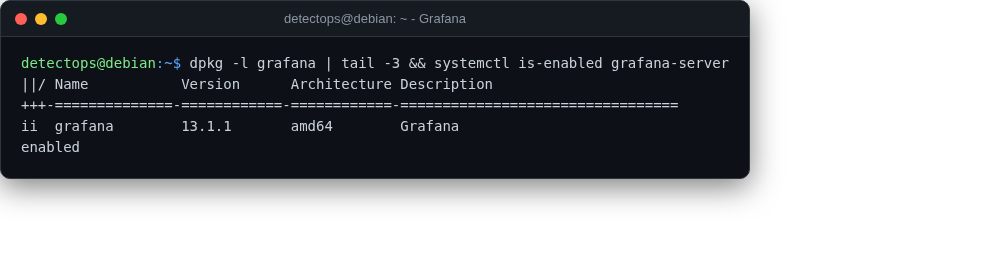
Grafana¶ service Dashboards for anything with a datasource — Loki included. How to run¶ sudo systemctl start grafana-server Note browse http://<vm-ip>:3000 — first login admin/admin, forces a reset Part of the Logging & SIEM toolset in DetectOps.